Matplotlib基本使用
最后更新时间:
文章总字数:
预计阅读时间:
一.Matplotlib简述
是一款用于数据可视化的 Python 软件包,支持跨平台运行,它能够根据 NumPy ndarray 数组来绘制 2D 图像。
Matplotlib 图形组成:
Figure:指整个图形,可以把它理解成一张画布,它包括了所有的元素,比如标题、轴线等
Axes:绘制 2D 图像的实际区域,也称为轴域区,或者绘图区
Axis:指坐标系中的垂直轴与水平轴,包含轴的长度大小(图中轴长为 7)、轴标签(指 x 轴,y轴)和刻度标签
Artist:在画布上看到的所有元素都属于 Artist 对象,比如文本对象(title、xlabel、ylabel)、Line2D 对象(用于绘制2D图像)等
二.常用函数
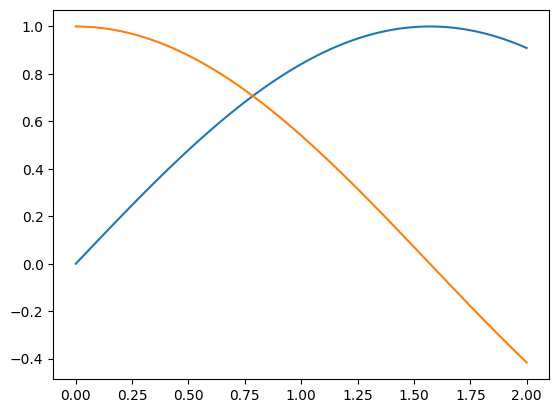
2.1 plot 函数
用于绘制二维图形,可以根据提供的 x 和 y 数据点绘制线条和/或标记。
1 | |
x : x 轴数据,可以是一个数组或列表。
y : y 轴数据,可以是一个数组或列表。
format_string : 格式字符串,用于指定线条样式、颜色等。
**kwargs : 其他关键字参数,用于指定线条的属性。
1 | |
结果:
2.2 figure函数
figure() 函数来实例化 figure 对象,即绘制图形的对象,可以通过这个对象,来设置图形的样式等
参数有:
figsize:指定画布的大小,(宽度,高度),单位为英寸
dpi:指定绘图对象的分辨率,即每英寸多少个像素,默认值为80
facecolor:背景颜色
dgecolor:边框颜色
frameon:是否显示边框
2.2.1 figure.add_axes()
在一个给定的画布(figure)中可以包含多个 axes 对象,但是同一个 axes 对象只能在一个画布中使用。
参数:
是一个包含四个元素的列表或元组,格式为 [left, bottom, width, height],其中:
left 和 bottom 是轴域左下角的坐标,范围从 0 到 1。
width 和 height 是轴域的宽度和高度,范围从 0 到 1。
1 | |
结果:
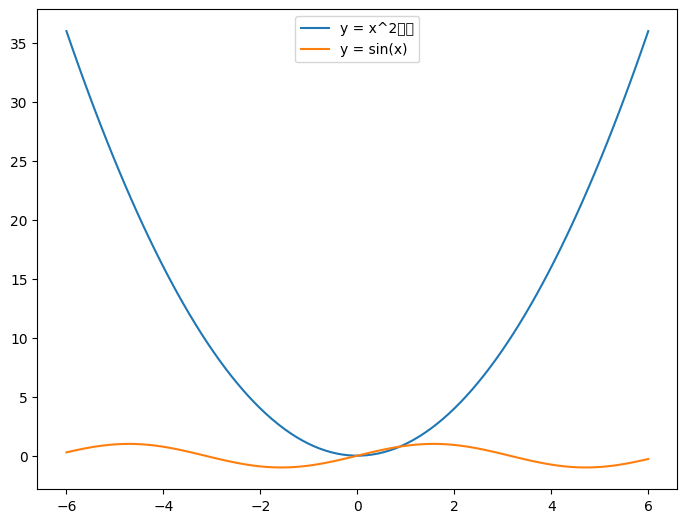
中文标签出现了乱码,要怎么解决呢?来看看下面的操作:
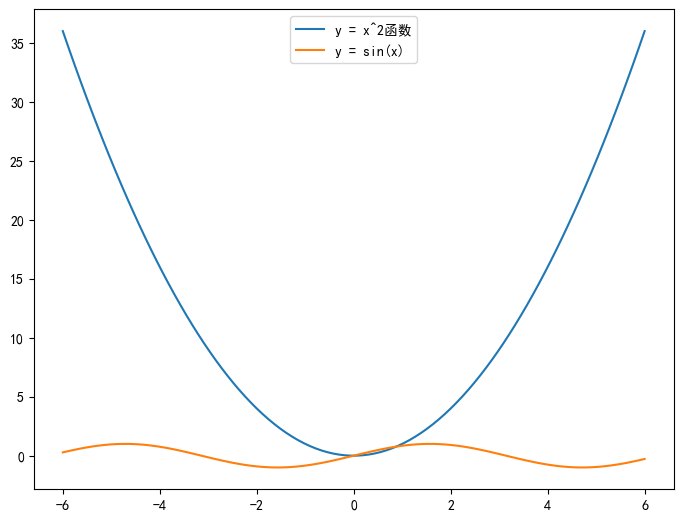
- 局部处理:
1 | |
结果:
- 全局处理:
1 | |
找到 matplotlibrc 文件,找到 font.family 和 font.sans-serif 项,去掉原有的注释符。
font.sans-serif设置加上支持中文的字体,如 SimHei。
同时,设置 axes.unicode_minus 为 False 以正常显示负号。
2.2.2 axes.legend()
既然上面用到了显示图例,那么下面就来介绍下legend()方法。
参数:
labels 是一个字符串序列,用来指定标签的名称
loc 是指定图例位置的参数,其参数值可以用字符串或整数来表示
handles 参数,它也是一个序列,它包含了所有线型的实例
这些参数既可以在plot绘制图形时加入,也可以在后面的legend函数终直接使用。
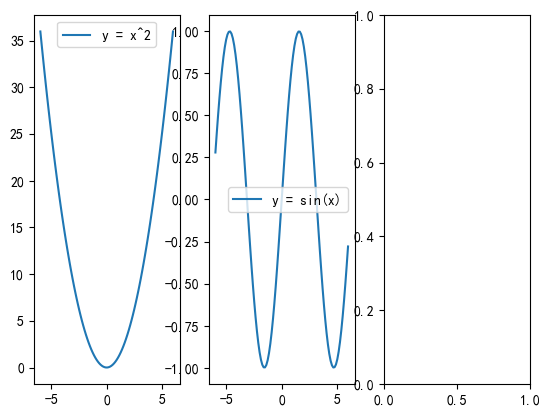
2.3 subplot 函数
通常用于创建网格状的子图布局。add_subplot 是一个更灵活的函数,它是 Figure类的一个方法,用于向图形容器中添加子图。推荐使用 add_subplot,因为它提供了更好的灵活性和控制。不过也有缺点,就是每次插入都要调一次add_subplot,比较麻烦。
1 | |
其中每个数字代表子图的行数、列数和子图的索引。
1 | |
结果:
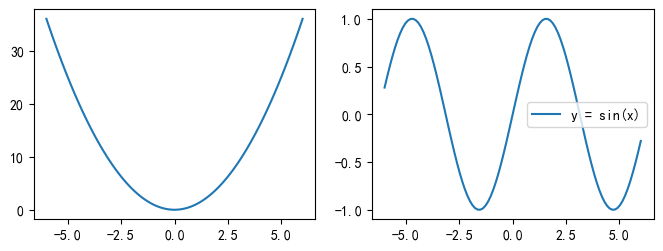
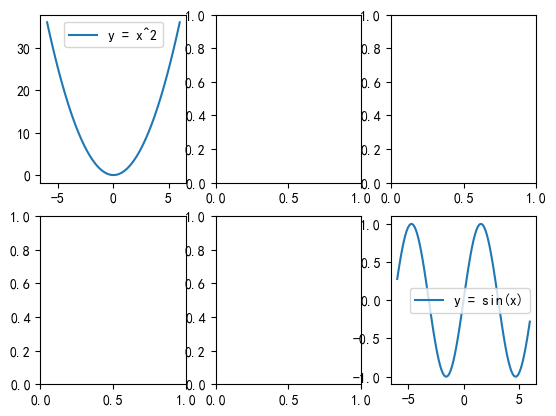
2.4 subplots 函数(对subplot的优化)
matplotlib.pyplot 模块中的一个函数,用于创建一个包含多个子图(subplots)的图形窗口。
subplots 函数返回一个包含所有子图的数组,访问下标可以在对应子图插入内容。
1 | |
参数:
nrows : 子图的行数。
ncols : 子图的列数。
figsize : 图形的尺寸,以英寸为单位。
1 | |
结果:
1 | |
结果:
小结:实际应用中,plot函数是用的最多的。